
We’re trying to expose more of the statistics we’re gathering to you, the seller. The latest one is more detailed sales stats for your items. Through a series of graphs we offer you greater insight into number of units shipped and returned, as well as reviews that items have received.
First, on the items listing page (https://www.zonmaster.com/items) we give you an overview of the last 30 days of sales, and how your items have performed. It’ll look a little like this:

We show you levels only for items that sold in the last 30 days. If you hover over a bar you’ll see the details in the top left.
You can click on the bar and that will take you to the specific page for that item, where you’ll see another graph, breaking down that item’s sales by month for as long as we have data:
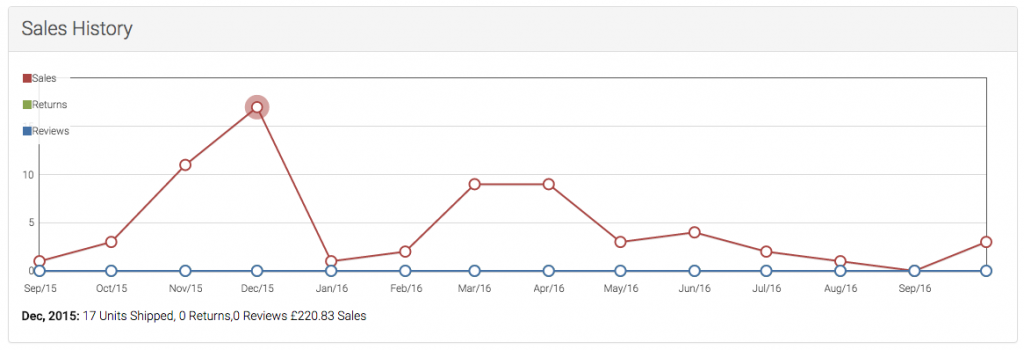
Hovering over the data points displays the info in the bottom left, showing you units shipped, returns and reviews for that month.
Finally, if you click on one of THOSE data points you’ll be taken to that month’s info, broken down by day:
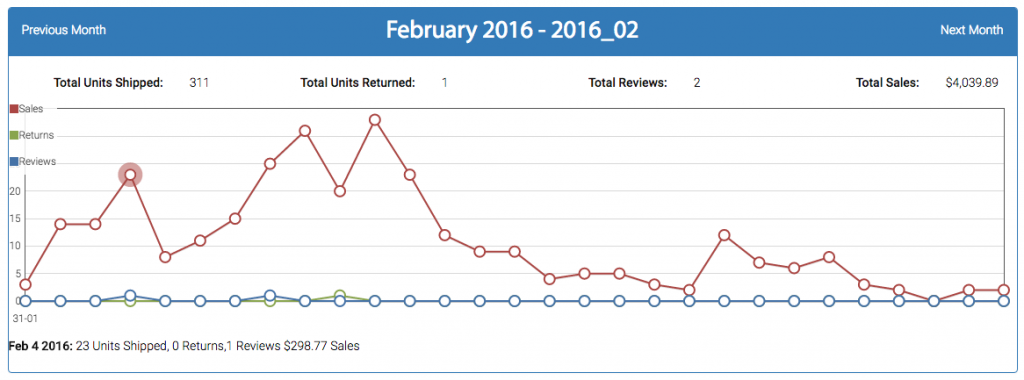
Once again, hovering over a data point will show you that day’s stats: units shipped, returns and reviews. You can go backwards and forwards through the months by clicking on the ‘Previous Month’ and ‘Next Month’ links at the top of the graph.
We hope you find this information useful! Let us know.

- Are My Emails Compliant with Amazon Policy? – August 22, 2023
- Amazon AI-Powered Reviews for Sellers: A New Era of Customer Feedback – August 16, 2023
- Amazon Prime Day Opportunities: Unlock Success with Amazon’s Prime Big Deal Days in October 2023 – August 13, 2023