
Recently we’ve rolled out an update to the main Dashboard inside your Zonmaster account. We are always striving to give you more information faster and clearer and we think this update is a good step in that direction!
Order Information – Updated!

At the top of the dashboard you will find yours orders. Like before, we show you a bar chart of your orders by day for the selected time period (more on this later), which defaults to the last 30 days.
What’s been updated is we now show you those orders broken down by status – Unshipped, Shipped, Delivered, Returned and so on.
The advantage of seeing your orders like this is you can quickly see if there is a delay in shipping or delivery, or if you have a higher number of returns.
Top Tip:
On any chart you can click on legend labels to hide that element. For example, to hide ‘Delivered’ orders from the Orders table simply click on it.

Emails – Updated!

We now give you two views on your Emails queue on the dashboard. The first – called By Date – is the usual breakdown of how many emails have been sent out, day by day, for the current period. We’ve also now broken those bars down into ‘per email template’ so you can see if there is change in what is normally going out.
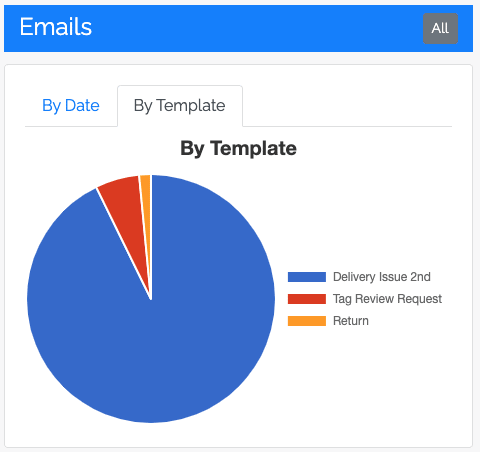
The second view, accessed by clicking the ‘By Template’ tab at the top of the panel, shows you a pie chart with the breakdown of which templates have gone out over the selected period.
Review Requests – New!

Next to the Emails section is a day by day look at how many Amazon Review Requests Zonmaster has processed on your behalf.
Seller Feedback – New!
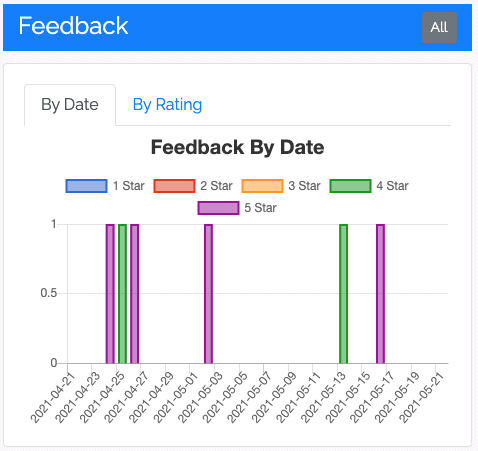
We have added a couple of charts so you can more quickly see your Seller Feedback. This previously was not shown on the Dashboard.

Now you can see the usual day by day breakdown of the Seller Feedback you’ve received, with the days broken down by the star rating.
If you click on the By Rating tab in that panel you can see the same time period, but showing you how many of each rating level you’ve received
Customer Reviews – Updated!
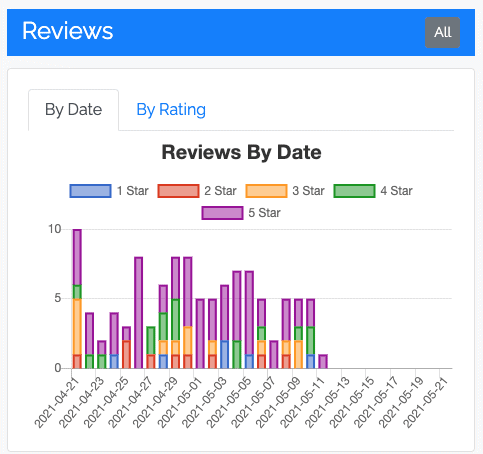
We’ve given the same update to the Customer Reviews panel. You can now see a day by day, broken down by review rating.

By clicking the By Rating you can see how many of each rating you’ve received.
Account Summary

We’ve kept our quick view chart that will show you the number of Orders, Returns, Emails, Reviews Requested, Positive and Negative Seller Feedback and Positive and Negative Customer Reviews, broken down by the last 7 days, 30 days, 90 days, 180 days and 1 year
Mail Queue

We have two tables that show you the emails sent in the last 24 hours, and the emails scheduled to be sent in the next 24 hours.
In these tables you can access the actual Mail Queue entry by clicking on the date. You can access the Email Template by clicking on the name of the message, and you can click on the Order Number to see the order details.
Seller Financial Stats

Finally, at the bottom of the dashboard we show you some quick financial stats on your Amazon Seller accounts – how many orders in the current month (month to date), how many units sold, what the total value of the Products sold is and what your average sale was.
Time Period – New!

At the top of the Dashboard is a new drop down menu that lets you change the time period that the dashboard shows you. You can choose the last 30, 60, 90, 180 or 365 days and all charts will update.
We hope you find these updates helpful in giving you more insights more quickly into your Amazon Seller data!
If you’re a professional Amazon Seller and not (for some crazy reason!) using Zonmaster, why not sign up today for your 15 day free trial – no credit card required. You get access to ALL our features, regardless of the plan you choose (yes, even the one that starts at $6.99 a month!)

- Are My Emails Compliant with Amazon Policy? – August 22, 2023
- Amazon AI-Powered Reviews for Sellers: A New Era of Customer Feedback – August 16, 2023
- Amazon Prime Day Opportunities: Unlock Success with Amazon’s Prime Big Deal Days in October 2023 – August 13, 2023
2 responses to “A Look At Zonmaster’s New Dashboard”
Hey. Great looking changes!
I recommend you consider one minor change. YOu said:
“On any chart you can click on legend labels to hide that element”. I think that is not intuitive, so 90% of users will not think to do that. Perhaps you could add a tiny phrase there about “click to hide” or something. Similarly with the ORders Manager, Sales by CHannel pie chart…. and perhaps other places.
Cheers.
You’re absolutely right! We will add that text in the next update. Thank you so much!